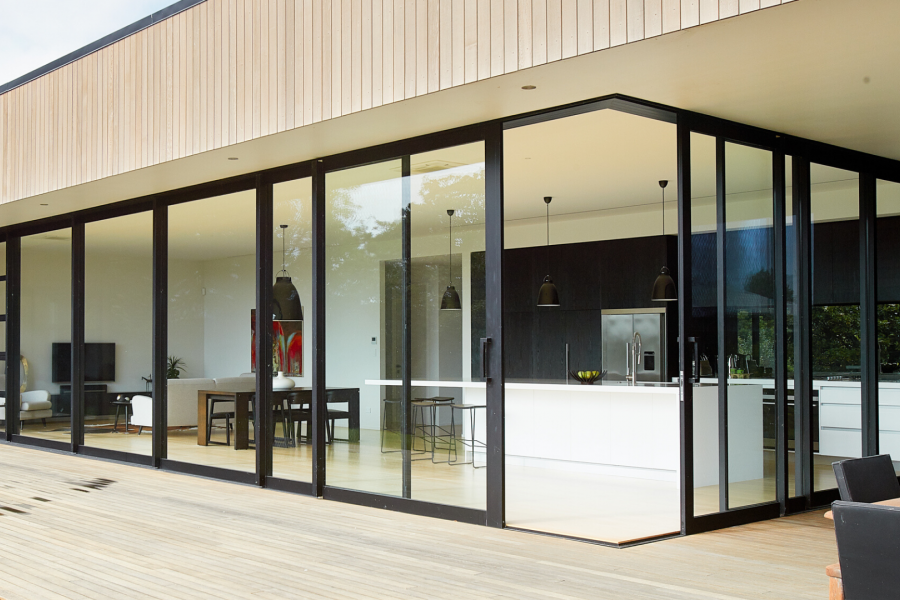
 VANTAGE Windows & Doors
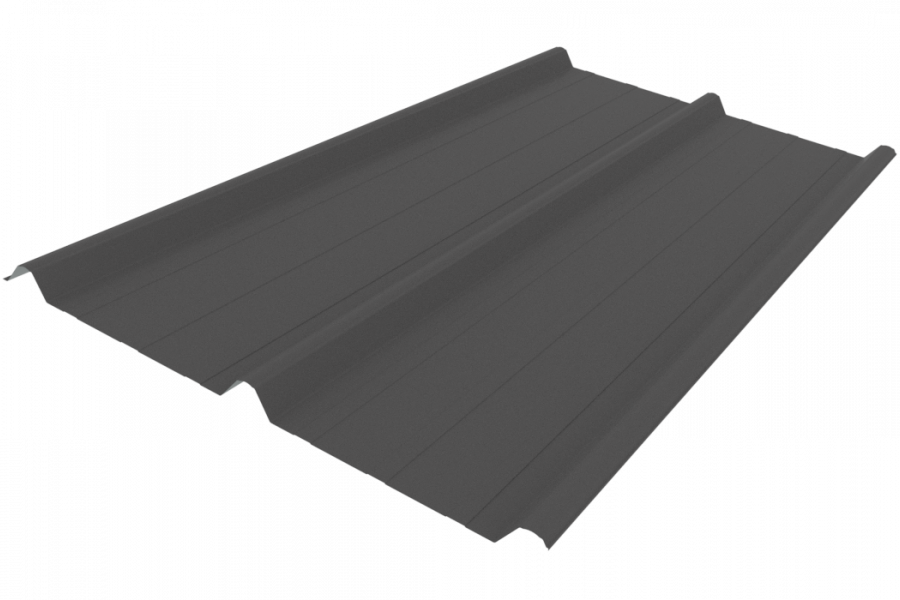
 Roofing Industries
 dormakaba
 SPAX
SPAX
 XLam Cross Laminated Timber Panels


 Bates Surfaces
 JESANI
 Aero
Aero


In promotional literature and technical publications dealing with the thermal performance of building construction details and materials, we often see diagrams showing the degree and pattern of heat transfer between the interior spaces and the exterior environment. This information is usually taken directly from computer simulations or research studies, but do they accurately and realistically reflect the real world where buildings are constructed?
Often the research results are presented visually with red colours to indicate the warm side, grading to blues for the cool/cold zone, sometimes with temperatures numbers added. I have no problem with this gradation as it gives an easy and quickly understood expression of the energy flows — it is a legitimate way to communicate the scientific results.
As a general rule, when scientific research is being undertaken, it is usually standard practice to standardise the variables which are not the actual subject of the investigation so that the differences in the results from the varying options being studied can be confidently compared. In the case of investigating the thermal performance of building construction assemblies or products, it is normal to standardise the adjacent building fabric, e.g. when looking at various types of window frames the materials of the abutting walls are kept constant, be they insulated timber frame, concrete blocks or SIPs modules. Also, the outdoor and indoor temperatures are kept constant; the outdoor usual is 0°C, and the room temperature 20°C or similar. Presumably these temperature constants, and the width of the range, are used as they allow for significant and measurable thermal gradients, and maybe they also relate to some international building research convention.
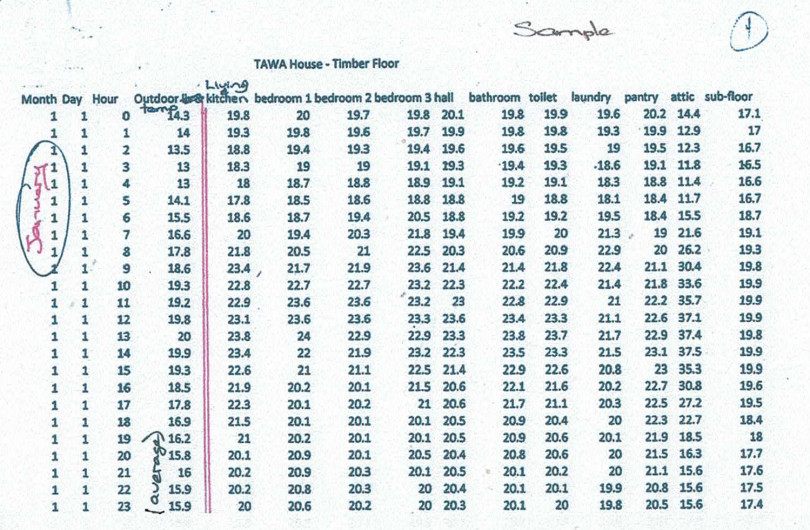
I have no problem with this scientific process, in fact I encourage it as too often we see building products being compared where it is not ‘Apples to Apples’ but actually ‘Apples to Oranges’. However, I do have a problem when it comes to applying the effects resulting from the standardised temperature ranges to actual buildings being constructed in our cities. For the vast majority of New Zealand houses, how many are subjected to long periods of 0°C temperatures? And how many people don’t close the curtains on a cold night, and leave them closed until the next morning? Also I don’t recall having seen any research results, relating to the thermal envelope of buildings, which bring in the factor of ‘Time’ as a dynamic variable — they all seem to assume that temperature is a steady-state condition. Most people who live in houses realise that usually there are heat gains during the day, and loses during the night (with the exception of a decent southerly-buster arriving in the early afternoon). Even when there are the occasional below average cold nights, they are often due to clear skies and so are preceded or followed by above average warm days giving increased solar gains (if the windows are arranged properly). While there is always a lowest temperature (and a highest) for a 24 hour period, how long does it usually last? Over the 24 hour cycle the temperature change does not follow a neat geometric curve, but it does swing over time between the daily extremes rather than moving by abrupt jumps.
With the recent interest in recessing windows, and the promotion of insulation to the edge of concrete slabs, I decided to look to see what the actual high and low temperatures are over a day, and seasonally, in our major cities. This is very easy to do and I encourage all readers to look at the weather data for their city on the MetService.com website. Below the 5/10 day forecasts for selected cities and towns there are 2 hourly records of the wind, high/low temperatures, and rainfall for the previous 24 hours, and also the same daily records for the previous month, as well as other data.
I was curious and so I took the month of September 2017, being on the winter side of spring, and made a simple analysis of the daily temperatures:
| Auckland | Wellington | Christchurch | Dunedin | |
|---|---|---|---|---|
| HIGH Daily temperature | ||||
| Highest | 20 | 19 | 24 | 23 |
| Average | 17.1 | 14.8 | 16.3 | 15 |
| Lowest | 14 | 13 | 12 | 11 |
| Mean | 17 | 15 | 16 | 14 |
| LOW Daily temperature | ||||
| Highest | 14 | 12 | 11 | 10 |
| Average | 10.7 | 8.7 | 4.9 | 7.8 |
| Lowest | 6 | 5 | -1 | 4 |
| Mean | 11 | 8 | 4 | 8 |
The lowest low temperature occurred in Auckland only on one day; in Wellington on one day, in Christchurch on two days one day apart with highs of 17°C and 13°C on those days; and in Dunedin also on one day. The average outdoor low temperatures are much higher than the 0°C used for research, and when allowance is made for well fitted curtains being drawn during the dark hours, for windows the inside temperature will be well below the 20°C assumed as the temperature of the inner glass surface and frame.
Perhaps when designing construction details for the thermal envelope of a building we should allow for outdoor temperatures higher than the 0°C used for research purposes, and consider that there is a much smaller temperature difference which will switch to an energy inflow sooner than implied by a 0°C daily low. I’m sure that the reality is that architects and designers instinctively allow for a higher low appropriate for their locality. Even so, I am not suggesting that scientists change their standardised variables because it is vital that results are quantitatively comparable.
Since 2009 I have been using AcuRateNZ thermal simulation software as a design tool to provide a consultancy service, through EcoRate Ltd, to Architects, Designers, Builders and building Procurers which gives an objective measure of the thermal performance of their residential projects, be they stand-alone houses or low/high rise multi-unit developments. I’m a registered architect (RAB# 1372) and my web-site is www.settlement.co.nz .

 Most Popular
 Popular Products